cAdvisor with StatsD, influxdb and Grafana


Why use cAdvisor with StatsD?
cAdvisor already have an influxDB backend and it works great, but, I would like to send data to StatsD and StatsD handle where I would like to send my data: InfluxDB, Zabbix or Grafite.
Another point, I don't really love the schema created by cAdvisor because, prior to InfluxDB 0.9, with a lot of data points, I need to filter on some metric, or node or container and it was sub performant.
It's why I made a really simple schema with StatsD and InfluxDB:
docker_node.container_name.metric with only one value. Yes, it's not the simplest schema for some aggregation on dashboard on the first view, but I will explain how I do it with Grafana later.
StatsD
Why I love StatsD? Because it uses UDP as transport, it aggregates stats before sending it to the backend, support many backends like Zabbix and InfluxDB and could easily scale.
Configuration
InfluxDB
For this blog post, we will keep all default configuration of InfluxDB 0.9. We will create a database and a user for our metrics. I will use the HTTP API, but you can do this directly on the web UI or with the influx command line.
On each curl request, you should add the basic authentication of an admin user: $ curl -u username:password
Create the database
$ curl -G 'http://localhost:8086/query' --data-urlencode "q=CREATE DATABASE cadvisordb"
> {"results":[{}]}
Create a retention policy
Now we need to set a retention policy, by default it's an infinite retention
$ curl -G 'http://localhost:8086/query' --data-urlencode "q=\
    CREATE RETENTION POLICY cadvisor\
      ON cadvisordb\
      DURATION 90d\
      REPLICATION 1\
      DEFAULT"'
> {"results":[{}]}
Create a user
$ curl -G 'http://localhost:8086/query' --data-urlencode "q=\
    CREATE USER cadvisor \
      WITH PASSWORD 'password'"
> {"results":[{}]}
Grant read and write to cadvisor on cadvisordb
$ curl -G 'http://localhost:8086/query' --data-urlencode "q=\
    GRANT ALL \
      ON cadvisordb \
      TO cadvisor"'
> {"results":[{}]}
StatsD
For statsd, we will use the influxdb backend. It's not a backend provided by default with StatsD, we need to install it manually.
$ git clone --depth=1 https://github.com/etsy/statsd.git
$ cd statsd
$ npm install statsd-zabbix-backend
{
  port: 8125,
  percentThresold: [95, 99],
  flushInterval: 10000,
  deleteIdleStats: true,
  backends: ["statsd-influxdb-backend"],
  influxdb: {...}
}
influxdb: {
  host: '<influxdb IP>',
  port: 8086,
  version: 0.9,
  database: 'dbname'
}
For a detailed list of option for InfluxDB, you can check on the influxdb backend repository
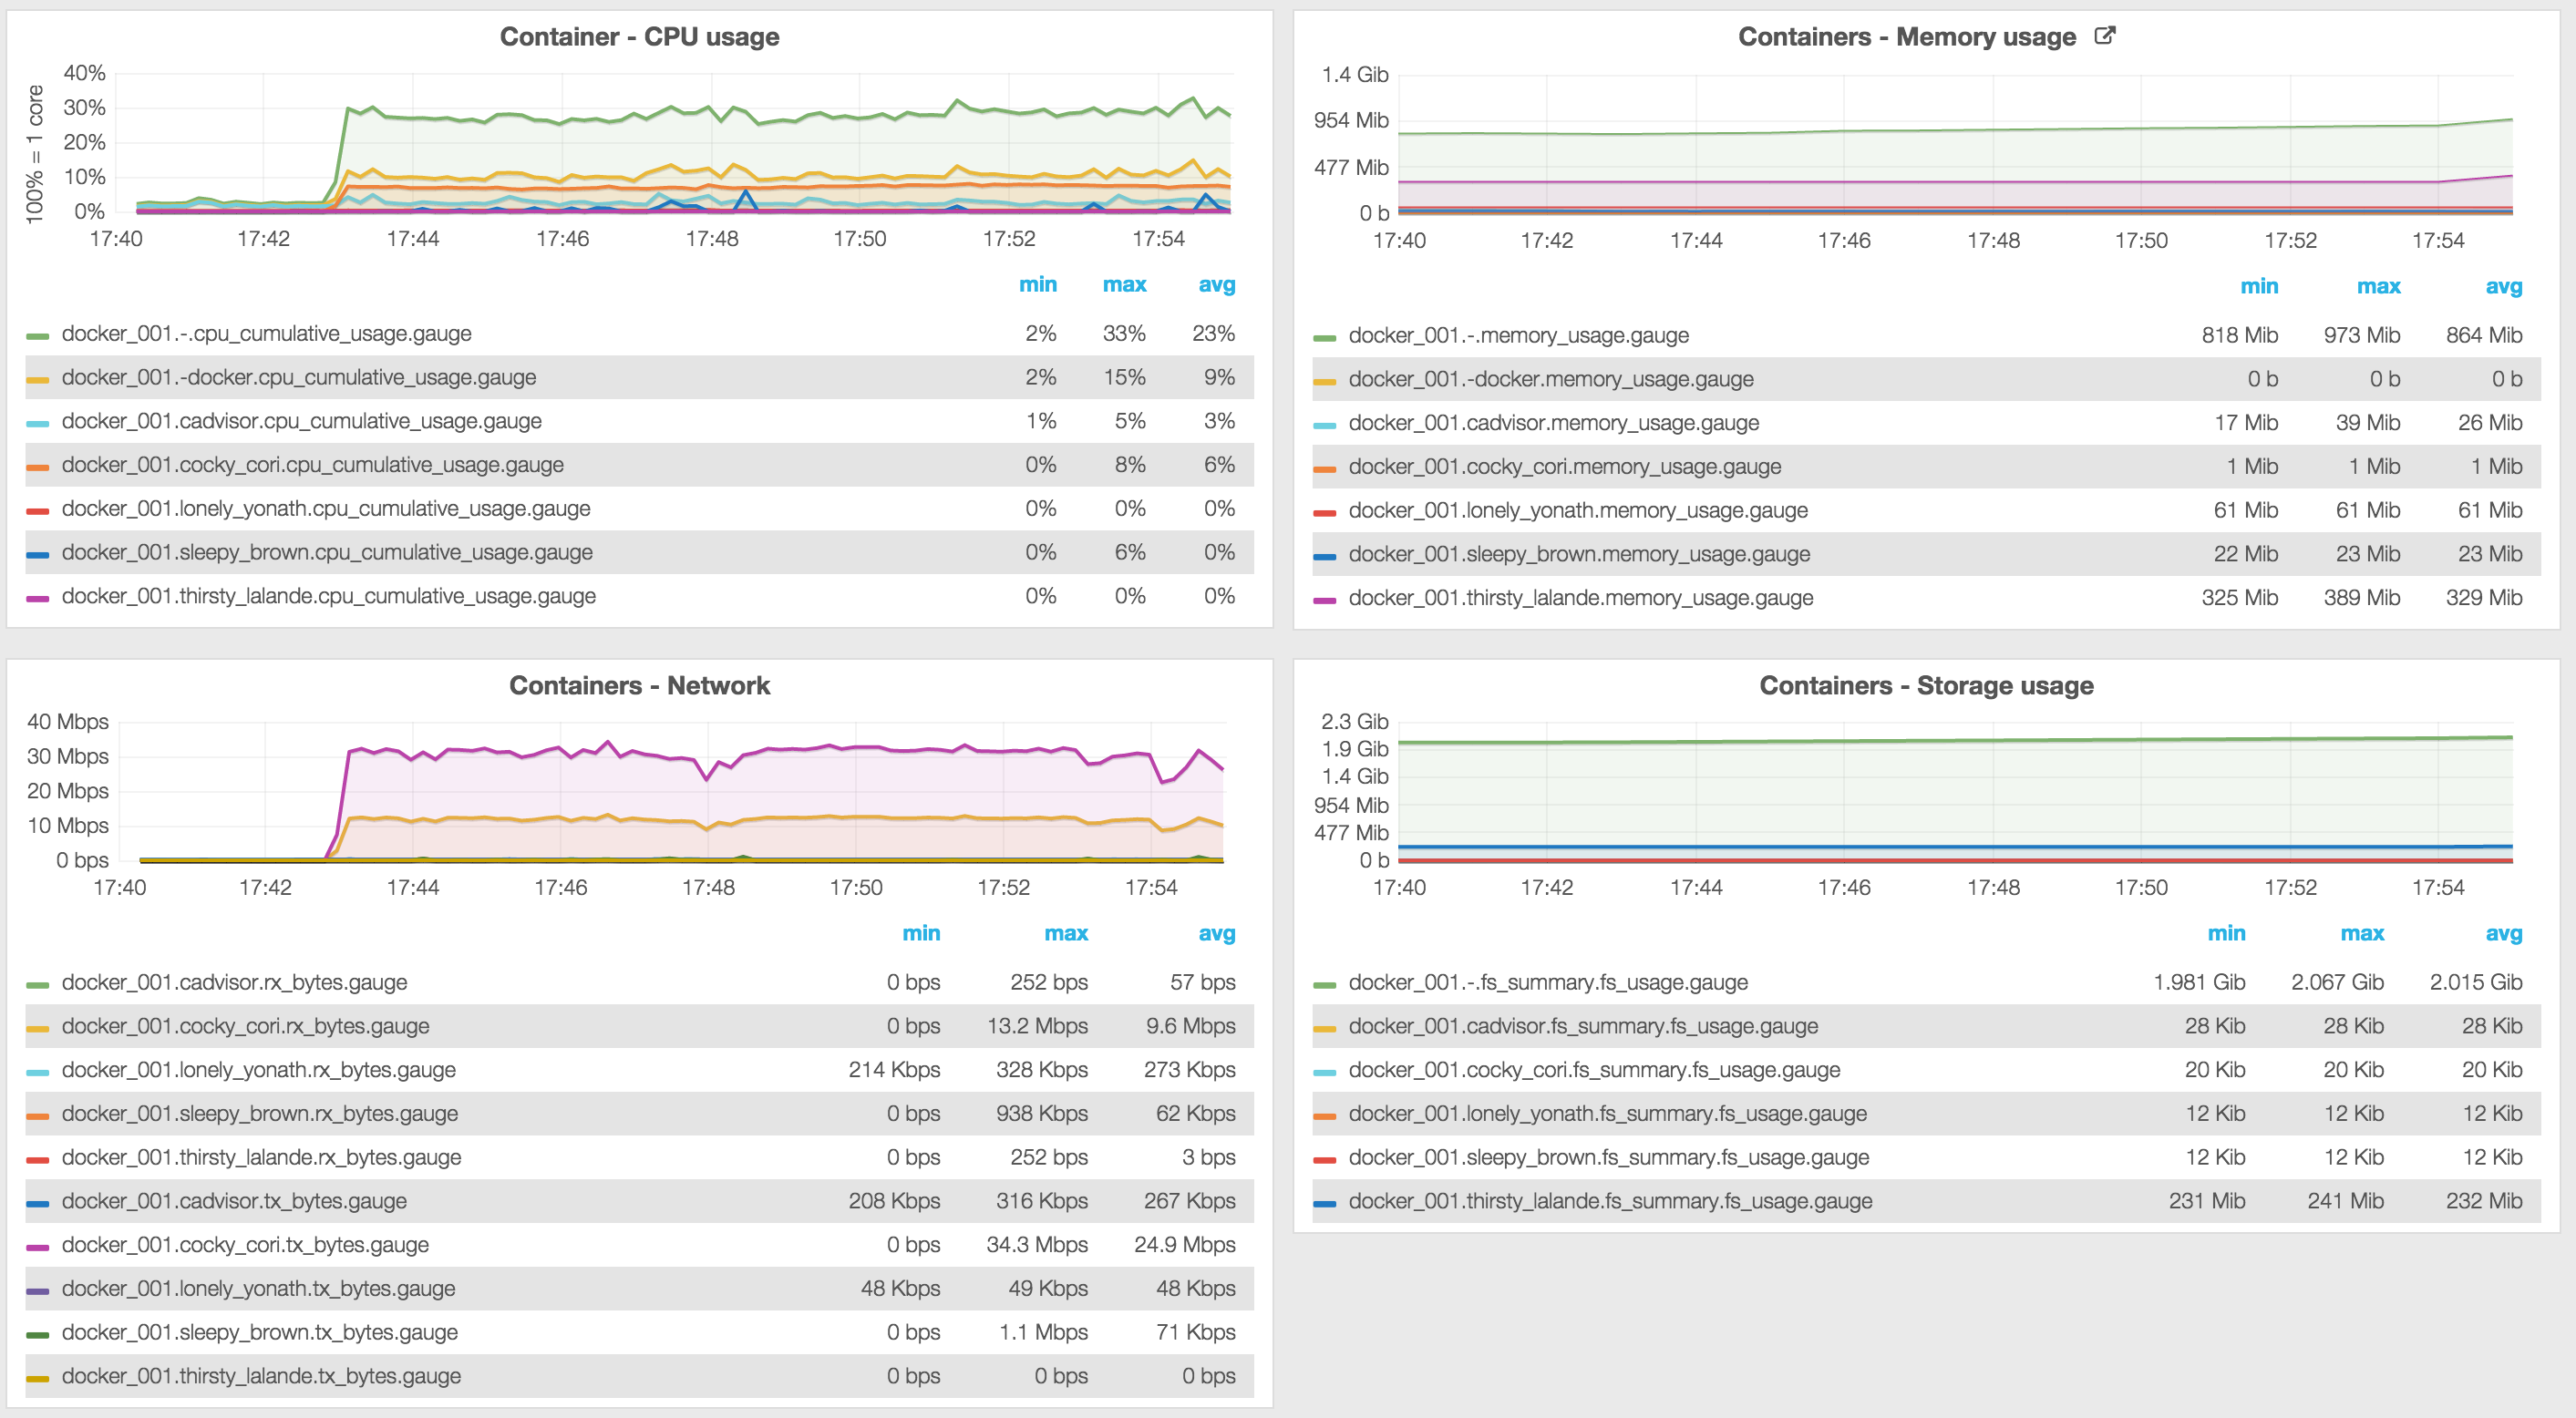
Grafana dashboard